Plot for effective of each method Age 13-19 Female

I have plot the method for Female whose age is from 13-19 and the y-asxis is the efficiency, the x-axsis is the name of each method


I have plot the method for Female whose age is from 13-19 and the y-asxis is the efficiency, the x-axsis is the name of each method

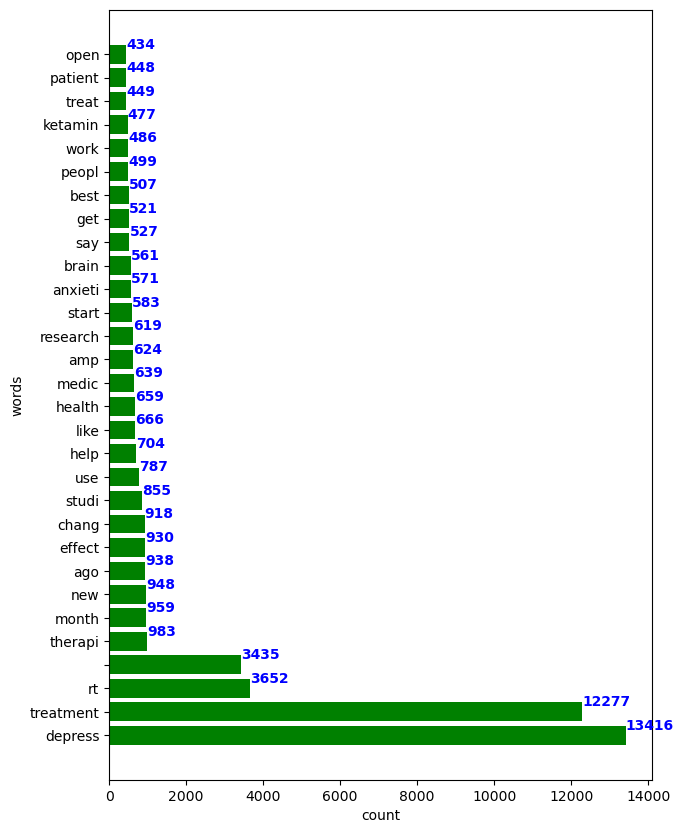
This plot based on Python twitter output

This plot based on Python twitter output