

For Naive Bayes method, I apply it on my record data using R and also apply it on text data using Python. Here my R data gather from a research and my Python data gather using NewsApi.
| R code for Naive Bayes | Python code for Naive Bayes |
|---|---|
| Cleaned data | Cleaned data |
| R Code to Naive Bayes | Python Code to Naive Bayes |
To understand whether there are significant differences in gender and age factors with different medication efficiency, age and gender were divided into four categories, and the naive Bayes model was established, and the training set and test set were used to test. It is found that the accuracy of the training set and the test set are very close, indicating that the model has a good effect, but the accuracy is not very high. In particular, men were more accurate and women were less accurate,older men (over 40) had the highest accuracy. It indicated that these drugs had obvious differences in gender and age factors, and the effect was more significant in men.
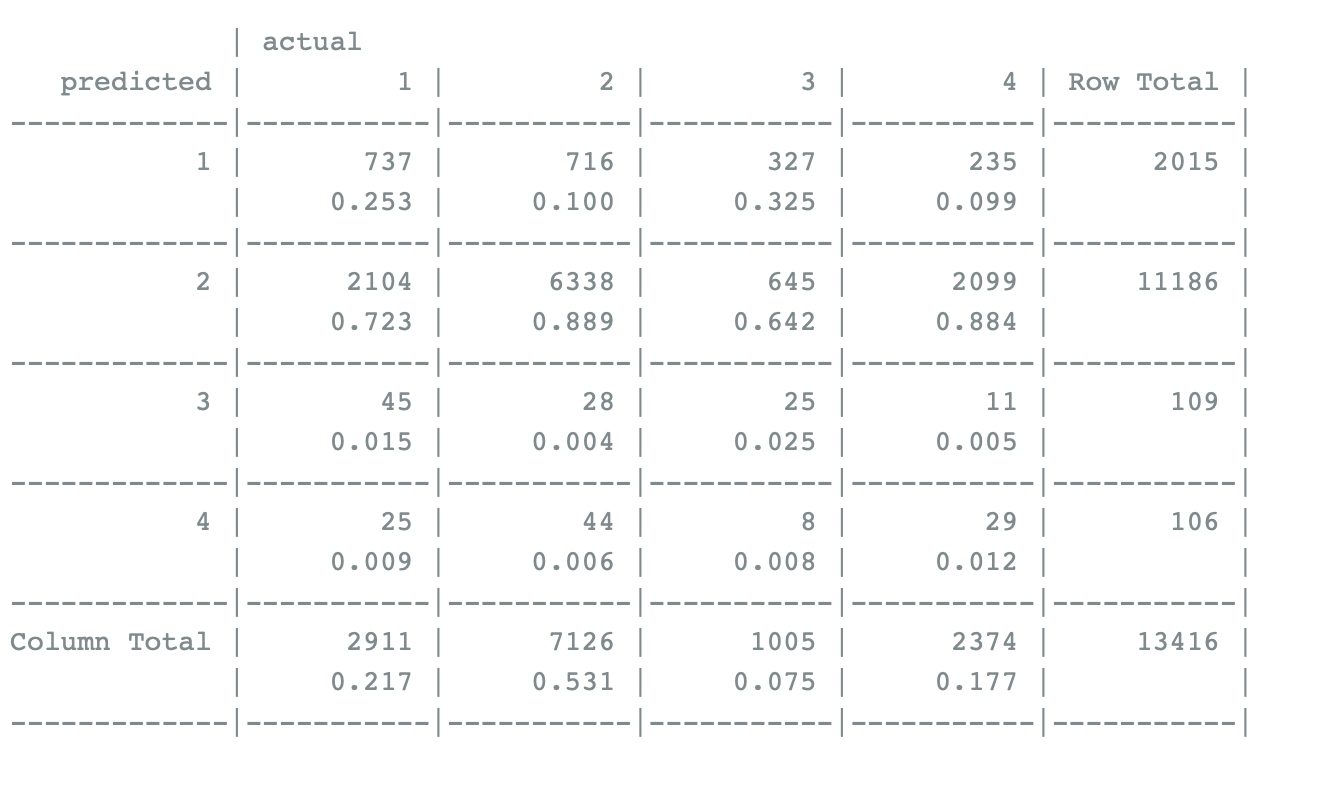
The data in the first 18 columns of the original data were selected and classified according to gender and age. Taking 40 years old as the cut-off point, the data were roughly divided into four categories, namely, young men, old men, young women and old women, which were saved as group factor variables. Finally, the TRAINING set and test set are divided by a ratio of 4:1 and named training and TESTING. There are many missing values in the original data. Since the naiveBayes function allows missing values when doing naiveBayes analysis, it will not calculate the true terms, so the missing terms are not processed.By setting random seeds and making descriptive statistics on the training set, information such as minimum value, first quantile, median value, mean value, third quantile, maximum value and number of missing values of each variable can be seen. The training set has a total of 13416 rows, of which the first group has 2911 rows, the second group has 7126 rows, the third group has 1005 rows, and the fourth group has 2374 rows. The second group accounted for more in the discovery group.
Use the training set to see model efficiency, the confusion matrix was established to check the fitting efficiency of the training set, and it was found that the accuracy rate was 53.14%, and the accuracy rate of the second group (elderly men) was as high as 88.9%, and the accuracy rate of women was very low, indicating that these drugs had a significant effect on elderly men (over 40 years old).

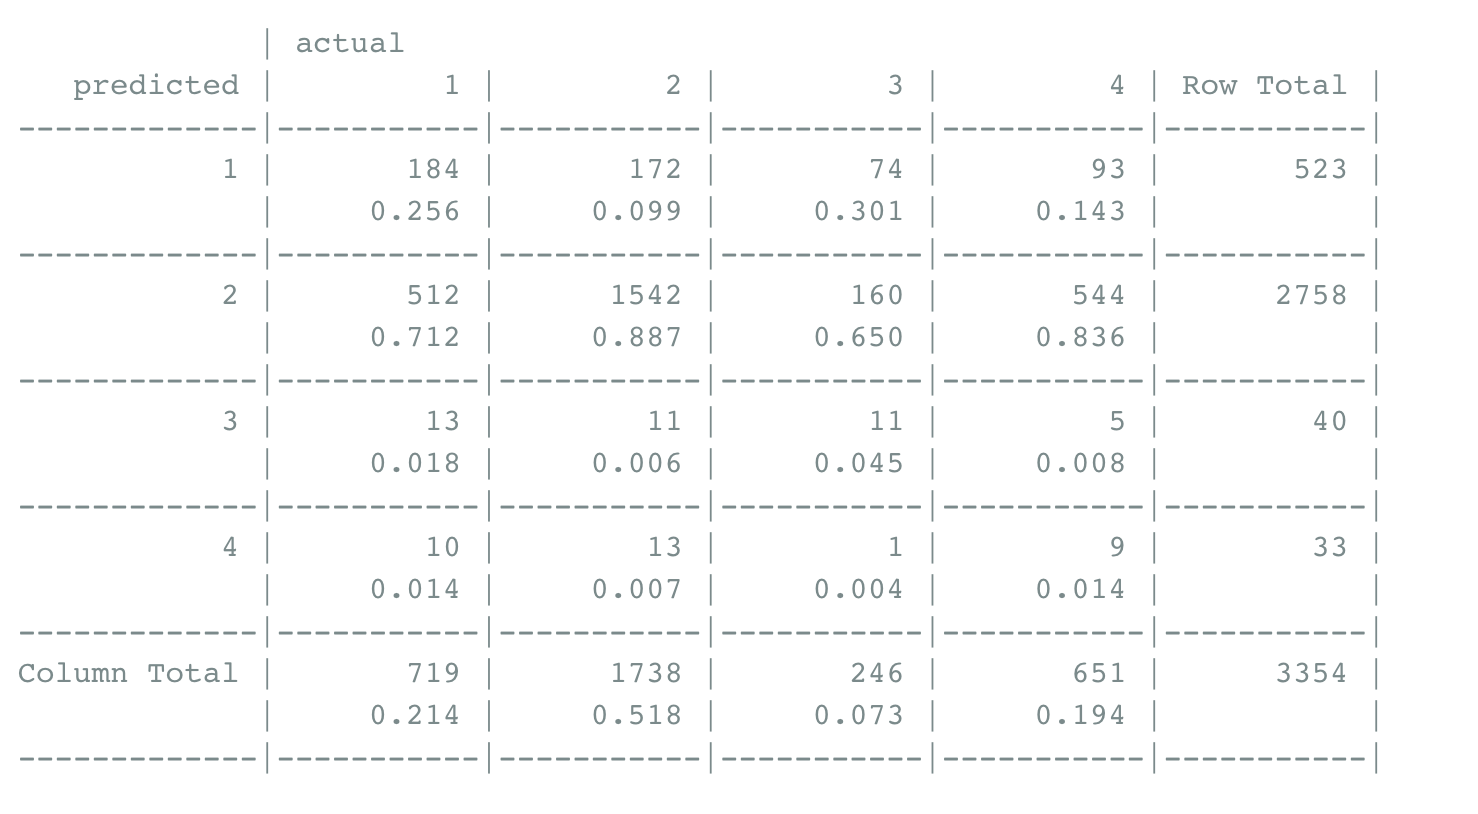
Test the model with test sets Using the test set to test, it is found that the accuracy is 52.06%, which is very close to the accuracy of the training set. Other results are consistent with the data of the training set, indicating that the model is accurate and the fitting result is good.

According to the above results, it can be found that both the training set and the test set have the highest accuracy of about 88% for the second group, namely, the older male group. It was followed by young men, meaning younger than 40, with an accuracy rate of about 25 percent. The accuracy rate for women is very low, all of which are less than 5%, indicating that these drugs have no significant change in women, so it can be said that the effect on women is not great.

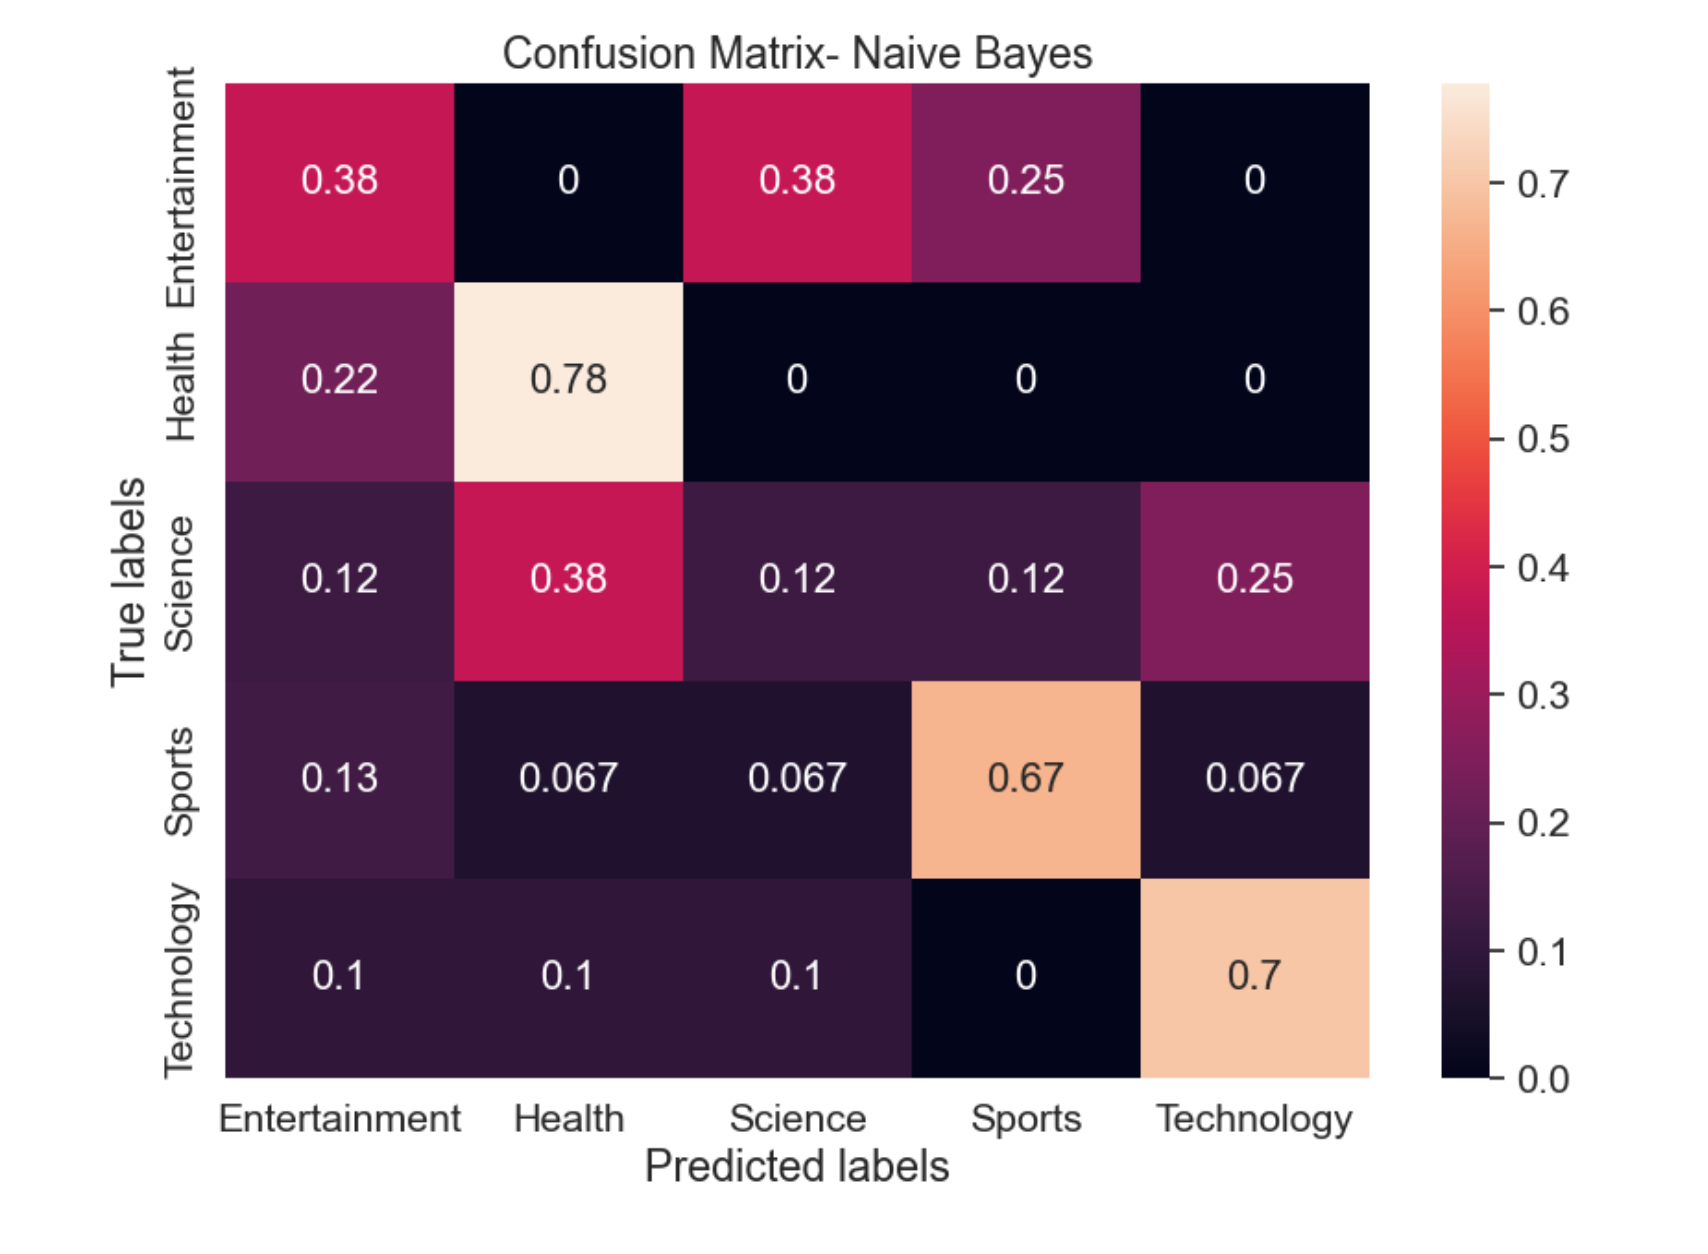
From the Confusion Matrix it is clear that Health labels were predicted accuracy the best with 78% accuracy followed by Technology, sports, Entertainment and Science.